
Planilha Profissional - Transformando dados em resultados!

Relatórios Profissionais
Transforme dados em insights valiosos para decisões.
Automatize processos com Power Apps e Power BI.
Gestão Eficiente
Automação de Processos
Portfólio
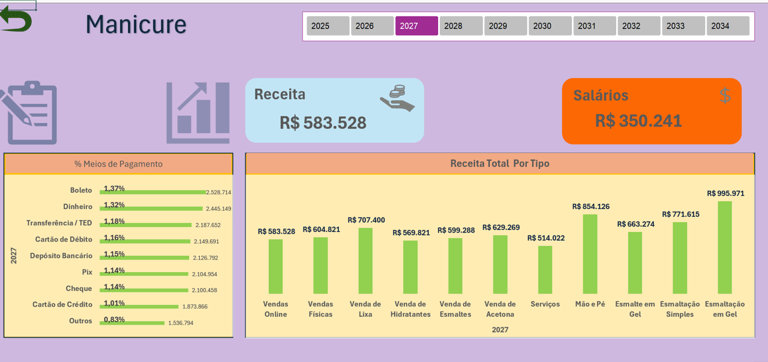
Controle FInanceiro Manicure
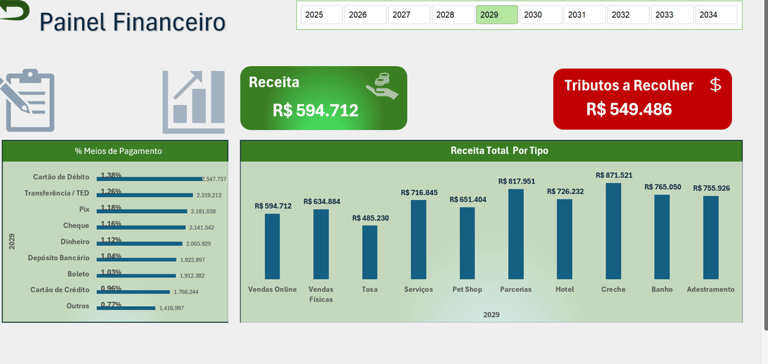
Análise Financeira Pessoal
Excelência em Gestão e Produtividade
Criação de sistemas e relatórios em Excel e Power BI para sua empresa.
Sistema de Cadastro VBA
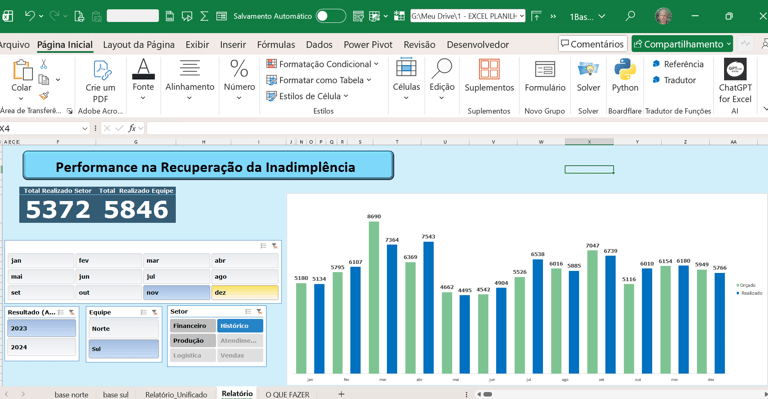
Performance de Recuperação de Inadimplência


Ocupação Hoteleira

Logística
Projetos Profissionais
Maximize sua produtividade com sistemas e relatórios personalizados.


Relatórios Excel e Dashboards
Planilhas que otimizam sua gestão empresarial transformando dados em Insights valiosos.


Power BI
Visualizações dinâmicas e interativas para suas análises.
Entre em contato e adquira sua planilha ou sistema
Ajudamos você e sua empresa a crescer com eficiência, estratégia e resultados reais.
Juntos, vamos transformar seu potencial em crescimento e sua visão em sucesso

